
I’m sure everyone had a great weekend, buoyed as they will have been by the almost-forgotten idea of Aston Villa securing three points at home. As per my usual Monday routine, today is “Talk Tactics” day, and that means analysis of the game, how and why we did what we did, as well as taking the time to look at individuals.
Firstly, I wanted to dispel the credence associated with the possession statistic. In a world where analysis can be made on the basis of something as tenuous as “gut instinct” from pundits (I’m looking at you Match of the Day), the odd stat that gets thrown in can be seen as relevant.
This isn’t always the case though. Whilst there is a well known logic to the fact that if you have the ball you can score and, by the same logic, if you don’t have it, you can’t, the possession statistic alone can bear no indication to the scoreline.
For example, if you look at either a lower league team, or a team that plays longer balls rather than short passing moves, their game plan is based on moving the ball quickly, often at a speed faster than the opposition, which can regularly mean that their time on the ball is low. In this example, it is highly possible for a team to be operating at a possession level below 45%, even below 40%.
I’m sure people are already asking what this has to do with the Swansea game, so I’ll tell you. Villa managed a mere 42.6% of the possession, something that possession obsessives might be complaining about. However, the team won 2-0, so what gives?
The truth is that, when looking at possession, one must always look at the territory statistic. In Villa’s case, they managed 56.6% of the territory, illustrating that whilst the Birmingham club may have ceded control of the ball, Swansea’s use of possession didn’t actually threaten.
Having the ball isn’t synonymous with doing anything with it
One only need couple this statistic with another pertinent variable – the number of attacking third passes – in order to get an idea of how penetrating a team is being. I’ll illustrate this via graphical interpretations later, but the simple use of numbers should prove Villa’s superiority despite their lack of possession.
For reference, Villa managed 164 attacking third passes, of which 95 completed. Swansea, by comparison, made 117 passes and completed 81 of them. In isolation, the numbers can seem largely irrelevant as nothing explains in that example whether the percentage completion rates are good or whether each number of attempted passes is good or bad.
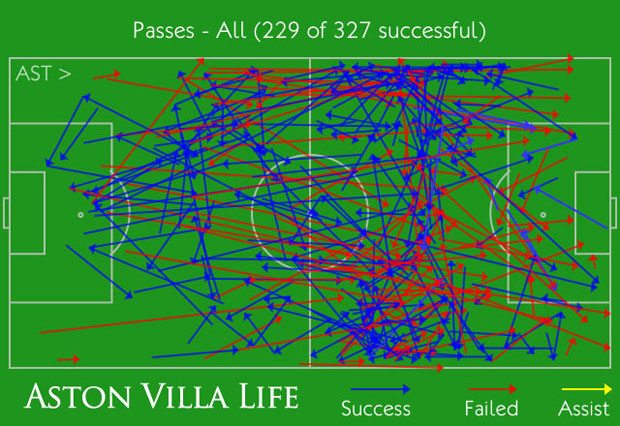
Again, these figures need context in order to show how a team has made use of their passes. To illustrate this further, I’ll begin with the first graphic, one that shows Villa’s total passes attempted.
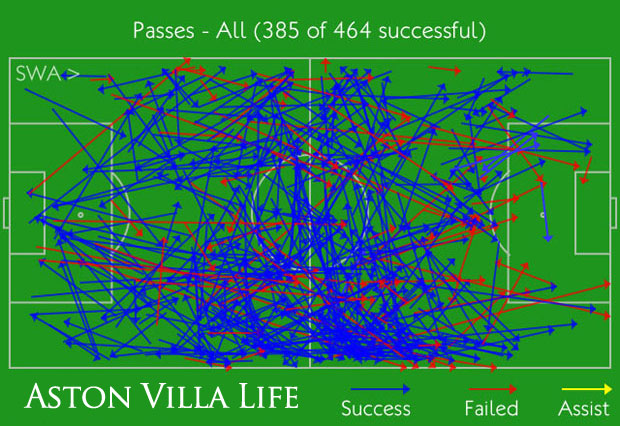
To compare directly, Swansea’s total passes attempted graphic is below:
As you can see from the graphics, Swansea both attempted and completed more passes than Villa. A quick use of a calculator will illustrate that Villa’s completion rate was 70% vs Swansea’s 83%. Again, on the balance of numbers alone without context, it looks like Villa would be trailing the game had we not known the score prior to this analysis. However, we all know that we did, in fact, win the game.
Beat the man, take him on
For the first time in this column, I wanted to break into different areas of analysis too. Sure, I could simply use the passes (attacking third and total) as well as the shots graphics each week, but this doesn’t always give enough context. Therefore I wanted to look at another key area where Villa did dominate – take ons.
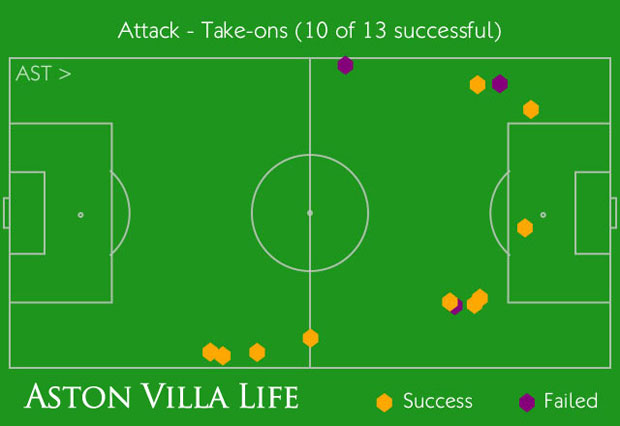
In order to visually show the take ons, both attempted and successful, I’ll put the graphics up below. First, the Villa take ons:
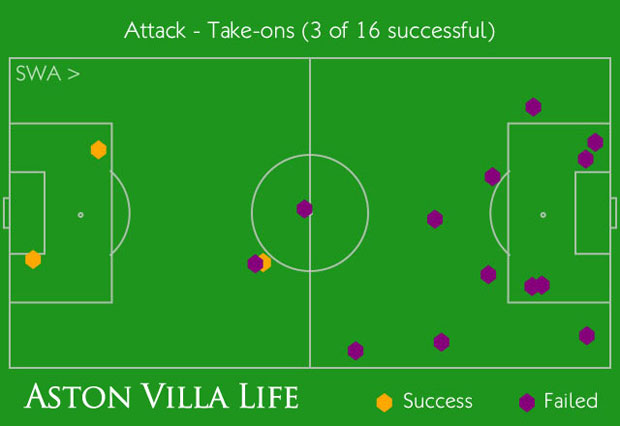
Then, the take ons of Swansea:
As you can see very quickly by checking the legend at the bottom of each graphic, Villa dominated the area of successful take ons. Sure, Swansea may have attempted more, but attempts mean nothing without end product – go ask two people who feels better when one buys two lottery tickets and wins a jackpot vs another who buys 100 a week and gets nothing.
Villa managed an almost 77% take on completion statistic, compared to Swansea’s miserable 18.75%. Couple this with the amount of Villa’s fouls – thirteen compared to Swansea’s four – and you will see that the team from B6 were not too worried about getting down and dirty. This isn’t to say fouls are a recommended tactic going forward, rather that, with context, they can round out a view on who “wanted it more” out of two sides.
It is all about the team, but then individuals deserve credit
Before my final comments, I wanted to take a brief look at a few of the players who warrant additional analysis. Whilst I could come up with a whole article on each player, I wanted to focus on the two goalscorers, Matthew Lowton and Christian Benteke.
Matthew Lowton
Lowton, a player whose goal was the most beautiful of the two scored, has been a steady influence since arriving at the club, and certainly did his reputation no harm with a goal that would befit a striker, never mind a full back.
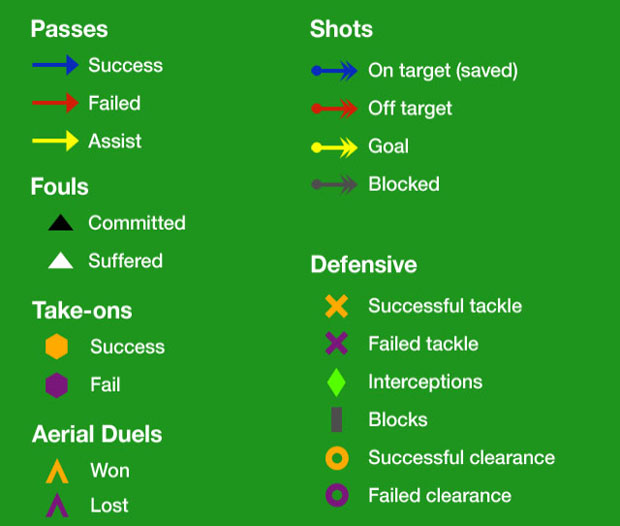
Before I insert the graphics, I must offer a key to what some of the symbols mean. Due to our data coming from Opta, each event is marked with a symbol, and there can be a bewildering number of them. So below is the reference for what the symbols mean:
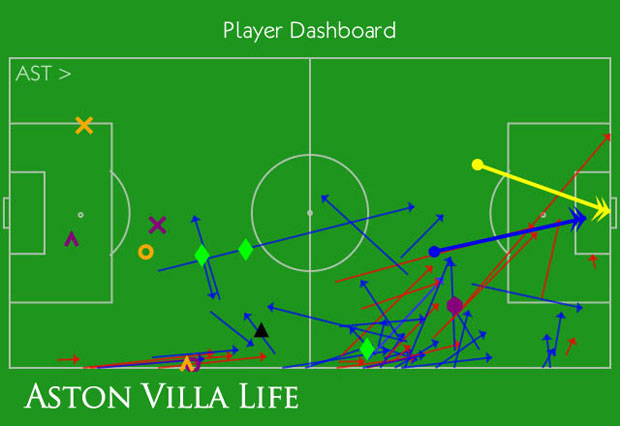
That should give you some knowledge with which to interpret Lowton’s play below:
Lowton made 29 passes overall, 20 of which completed. Of his 29 attempted, 16 were attacking third passes with ten of those passes completing. Only two of his passes attempted were long, one of which was successful. The remainder were short.
Lowton was perhaps unlucky to get a yellow card for a single foul but, as those of who watched the game realised, the referee was card happy to say the least.
Capping a game with a goal is always a bonus, and Lowton’s goal was a peach. In his after match interview, he spoke of the pride that he felt in scoring, especially since he had invited family down to watch his performance.
Christian Benteke
Moving on to Villa’s new goalscoring hero – “He’s big, he’s tall, he’s tidy on the ball, Benteke! Benteke!” – I wanted to close the piece with some analysis of Benteke’s cameo appearance. Actually, terming it a cameo appearance does seem to underplay the impact the player had because, from the moment he took his tracksuit off, to the end of the game, Benteke’s presence brought something else to the game.
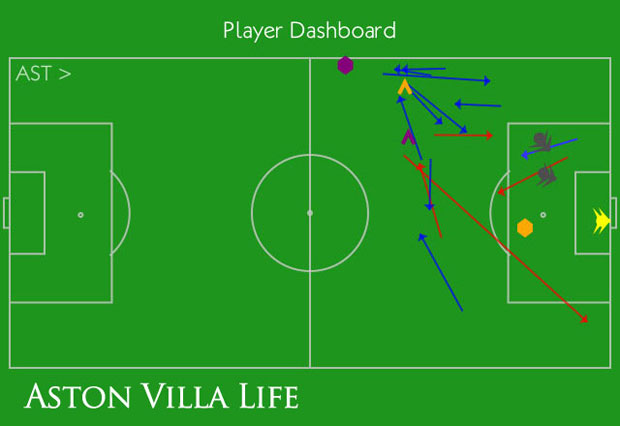
Below is the graphic illustrating Benteke’s events he was involved in (use the same key above that illustrated what each symbol means):
Despite Benteke having so little time on the pitch, his impact brought two blocked shots and a goal – if there is something to be said for the excitement and impact such a player can bring, there’s the evidence of it.
Beyond his goal, his control, movement, and ability shone. Despite the size of the Belgian international, his control is absolutely top quality, often taking the ball on his chest with his back to goal before passing or moving with power. Analysis of the player in this article may have been brief, but he will provide more information for analysis over the coming weeks, I have no doubt.
To finish, I also wanted to say a big well done to Darren Bent. He’s attracted my criticism before this season (with good reason to be fair) but he’s shown now that he can contribute to the game in a more solid manner than simply playing as the last man, eternally trying to poach goals. Darren – keep up your work rate and, rest assured, you will have everyone of us behind you from now on. Below is a final graphic showing player influence (a bigger name is better):
I hope everyone enjoyed the article, and look forward to further analyses from me that will be coming to you, in the near future, in a new and interesting format. Stay tuned.
Podcast: Play in new window | Download
