
After the game on Saturday, many fans will be shaking their heads and looking disappointed at a solitary point won from the home game against Norwich City. From a view of Friday night, one point will have felt like a disappointment, whereas by Saturday night, a point felt like a very lucky reward.
Tactically, Aston Villa set up in a 4-4-2, presumably trying to ensure more width to their play by deploying Brett Holman and Marc Albrighton on the flanks, though this focus left other issues that caused more problems for the club.
Are some of these players good enough?
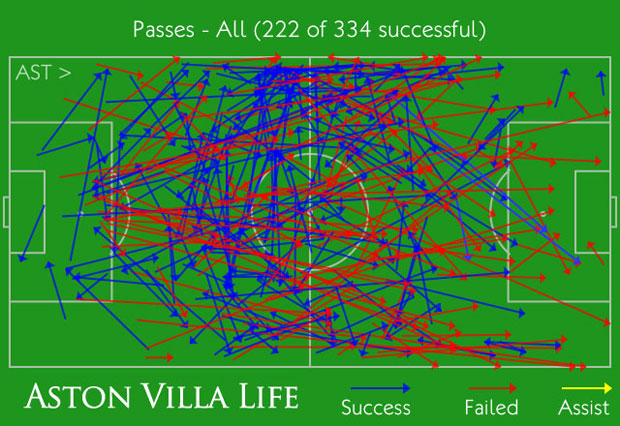
Let me start by throwing out a few of the key statistics of the match. Villa’s pass completion was a poor 66% completing only 222 of 334 passes. Norwich completed 351 of 455 passes giving them a comparatively better 77% completion.
Getting into possession and territory statistics, Villa failed to impress again, recording 41.7% possession against Norwich’s 59.3%, and managing just 41% of territory, compared to Norwich’s 59%.
As I’ve stated many times before, possession alone does not win matches, but being behind in both possession and territory does indicate that Villa were the second best team.
Glancing over some of the other key statistics before I get into details, Villa had less attempts on goal, less shots on target, and less blocked shots – the figures don’t paint the greatest picture.
We’ll start with passing
Below you will find the graphic for Villa’s passing, and you won’t be overly surprised to see a mass of red arrows. So first, I’ll show you those passes visually before going on to analyse them:
To make some practical sense of the graphic, we need some figures to back things up. Yet again the team completed a small portion of long balls, managing to complete only 20 out of 63 attempted. The question begs – why are we still doing this?
It isn’t just about length of pass however as looking at forward passes Villa completed 96 of 196 of them, translating to ~49% completion . Comparatively, Villa completed 75 of 81 backward passes. To round out the passing statistics, Villa completed just 38 of 97 passes in the attacking third, a mere 39.2%.
What does this have to do with the game? Well part of these statistics indicate that the ball is being passed around, though backward travelling passes (generally) do very little. Villa were also unable to effectively penetrate Norwich due to the lack of completed attacking passes.
It is very easy to laud the passing game as the salvation of the club, but passing has to have some degree of penetration to it as otherwise it is just an exhibition on giving and receiving the ball. As everyone knows, if you can’t score, you can’t win (barring own goals obviously), and if you can’t complete passes in the attacking third, your chances are probably going to be limited too.
The fact remains that the passing against Norwich was poor by the home side, lacking penetration, and regularly not completing. How can Villa expect to get anything from a game without these key aspects of good football?
Playing wide – Villa’s lack of an identity
On Saturday, Holman and Albrighton took as much as a wide role as their abilities allow them to and illustrated a first time usage of real wing play. As has been mentioned several times before, Villa are severely lacking in the winger position – I count only Albrighton as a traditional winger – and thus playing wide is a somewhat dangerous prospect.
In fact, I covered this as part of last week’s Talk Tactics column stating that whilst Villa were clearly suffering under a narrow formation in past games, the quality level of players stops the change being as simple as merely playing wider.
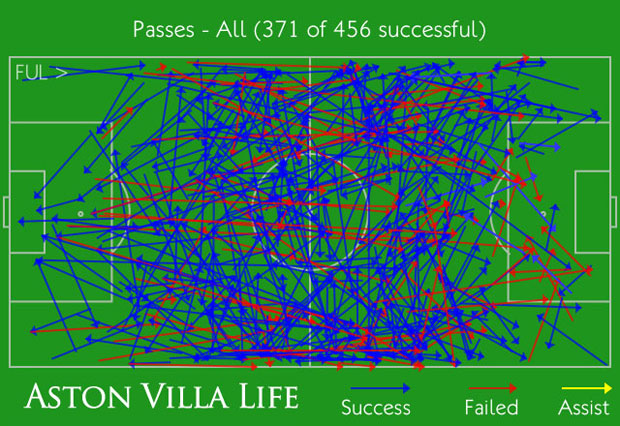
To illustrate part of the impact of width, I wanted to look at Norwich’s passing graphic, in particular at the distribution of passes, and how they compare to past games.
The passing distribution is far more uniform when compared with the last game against Fulham. In the game at Craven Cottage, there was far more use of the flanks with Fulham clearly wanting to take advantage of Villa’s lack of width, and looking to exploit two on one opportunities where Joe Bennett and Matthew Lowton would be exposed.
Against Norwich, the passes were spread out evenly, essentially considering all areas of attack equally viable for attack as Norwich will have had equal or superior numbers in all of the midfield areas, as opposed to Fulham having spacial advantage in the wider areas due to Villa’s narrowness at Craven Cottage.
Shooting boots & created chances
A few weeks ago, Villa and Norwich were amongst the worst converters of chances in the Premier League with both teams having a sub 10% chance conversion rate. With Norwich creating a full ten more chances than Villa on Saturday, even the statistics go some way towards suggesting the home side were lucky to get a point – a poor result considering Villa’s position as the home team.
I should stress at this point that I am not implying that ~10% probability indicates that 10 chances means a goal – probabilities don’t work like that mathematically – but that ten chances were only failed to be converted because of a combination between Brad Guzan’s man of the match performance, and Norwich’s profligacy.
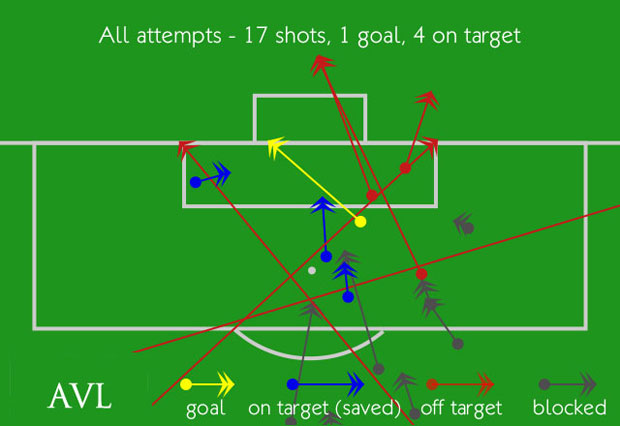
I’ll illustrate this by showing Norwich’s scoring chances below:
Of the 17 attempts Norwich had, seven of them were blocked. A significant number of these seven blocks were enacted by Brad Guzan, a player who is looking evermore likely to be one of Lambert’s cleverest transfer moves, even if he was only a re-signed contract. Again, the fact that Villa’s goalkeeper was the man of the match tells a story of itself – Villa were simply not good enough.
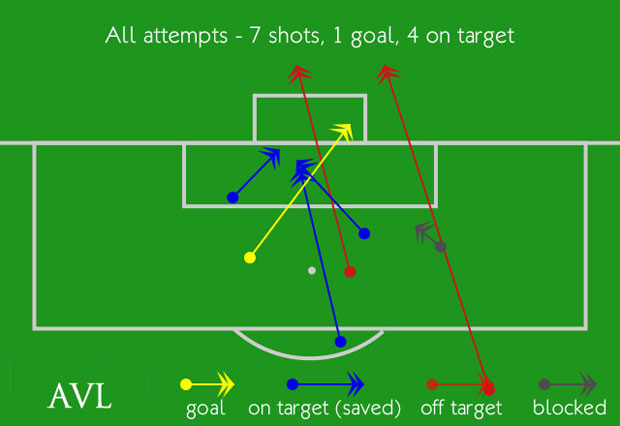
To complete the scoring chance analysis, we can look at Villa’s graphic below:
Villa had four shots on target, coincidentally the same number of shots on target as Norwich, though only one of Villa’s shots was blocked. The remaining two Villa chances were off target.
This may sound like a terribly obvious statement, but had Norwich had any kind of normal conversion rate, Villa would have lost the game – fans can only be thankful that the away team were almost as poor as we were.
Brief analysis of other key stats
To close out the article, I thought I’d share a few key stats remaining from the game, many of which show Villa as nothing more than second best. Running through them quickly, the stats are as follows (Villa’s figure on the left of the hyphen as the home team, Norwich on the right. First figure before the slash is the completed figure, second is the total figure):
Crosses: 3/11 – 5/37
Take-ons: 2/9 – 9/17
Corners: 1/3 – 2/8
Offside Passes: 2 – 7
Tackles: 12/16 – 12/14
Interceptions: 16 – 10
Blocks: 7 – 1
Clearances: 19/37 – 14/25
Headed Clearances: 7/15 – 5/11
Aerial Duels: 26/46 – 20/46
Briefly this illustrates that Villa had more tackles attempted, largely due to Norwich’s larger territory and possession, but fell behind the Norfolk based team on cross, take-ons, and corners.
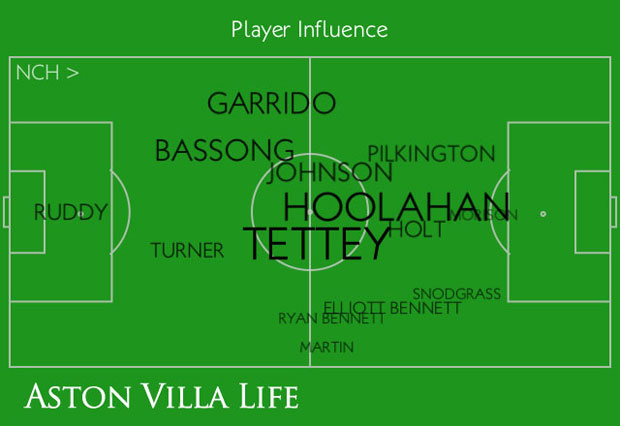
As a final graphic, I’ll put up the influence graphics for both teams and let you make your own mind up on them – many commenters have suggested Wes Hoolahan as a player for Villa’s midfield, and they will probably feel the Norwich graphic below only serves to strengthen that belief.
Below is Villa’s influence graphic:
And finally Norwich’s influence graphic:
So will Villa manage to pull something out of the wreckage of a game where a point was actually a lucky escape? Or will there be more issues to come as Villa prepare to face Swindon Town on Tuesday? Here’s to hoping that a positive result in the cup bolsters confidence ahead of the trip to draw masters Sunderland as a challenging set of November fixtures sits beyond the horizon.
